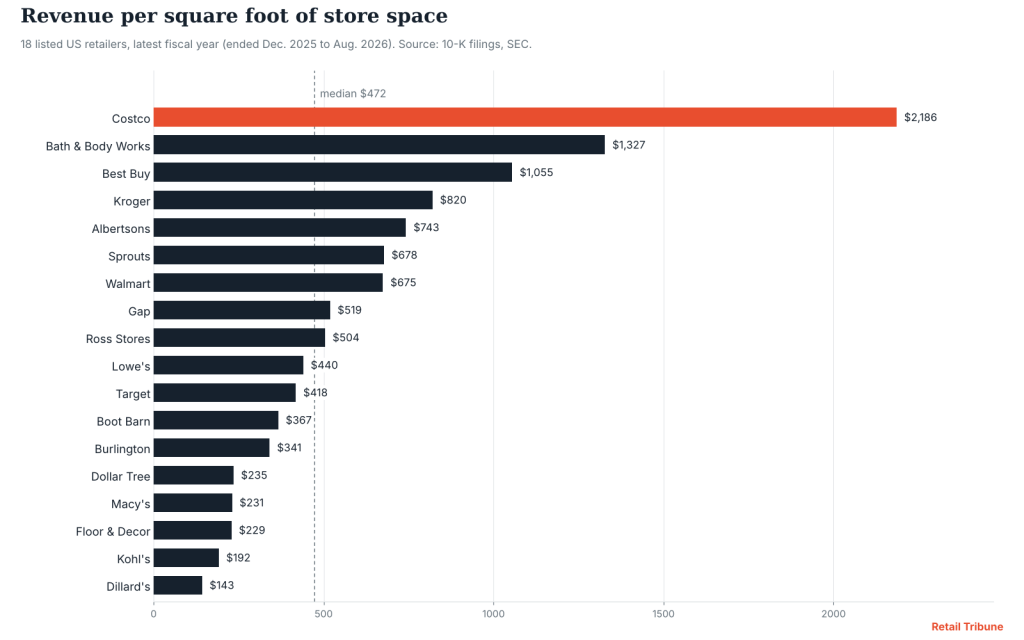
Each square foot of Costco warehouse generated about $2,186 of revenue in the fiscal year ended August 2026. At Dillard’s, the department store chain from the US South, it was $143. Fifteen times less. Both figures come from the annual reports these companies file with the US Securities and Exchange Commission.
Retail Tribune ran the numbers for 18 listed retailers: total revenue for the fiscal year divided by the store space disclosed in the same report. The median is $472 per square foot, or about $5,080 per square metre.
The table
Ranked by revenue per square foot, latest fiscal year. Each retailer’s name links to its annual report. The “space reported” column uses the company’s own definition, which varies from one to another.
| Retailer | Fiscal year ended | Revenue ($bn) | Space (million sq ft) | Space reported | Revenue per sq ft ($) |
|---|---|---|---|---|---|
| Costco | 2026-08-30 | 303.2 | 138.7 | warehouse operating floor space | 2,186 |
| Bath & Body Works | 2026-01-31 | 7.3 | 5.5 | selling square feet | 1,327 |
| Best Buy | 2026-01-31 | 41.7 | 39.5 | store square footage | 1,055 |
| Kroger | 2026-01-31 | 147.6 | 180.0 | supermarket square footage | 820 |
| Albertsons | 2026-02-28 | 83.2 | 112.0 | total retail store square footage | 743 |
| Sprouts | 2025-12-28 | 8.8 | 13.0 | total square feet | 678 |
| Walmart | 2026-01-31 | 713.2 | 1,057.0 | retail square feet | 675 |
| Gap | 2026-01-31 | 15.4 | 29.6 | store square footage | 519 |
| Ross Stores | 2026-01-31 | 22.8 | 45.1 | selling square footage | 504 |
| Lowe’s | 2026-01-30 | 86.3 | 196.0 | sales floor | 440 |
| Target | 2026-01-31 | 104.8 | 250.5 | retail square feet | 418 |
| Boot Barn | 2026-03-28 | 2.3 | 6.1 | selling square footage | 367 |
| Burlington | 2026-01-31 | 11.6 | 33.9 | selling square footage | 341 |
| Dollar Tree | 2026-01-31 | 19.4 | 82.6 | selling square feet | 235 |
| Macy’s | 2026-01-31 | 22.6 | 98.0 | total square feet | 231 |
| Floor & Decor | 2025-12-25 | 4.7 | 20.5 | store square footage | 229 |
| Kohl’s | 2026-01-31 | 15.5 | 81.0 | selling square feet | 192 |
| Dillard’s | 2026-01-31 | 6.6 | 46.0 | total square feet | 143 |
Costco in a league of its own
Costco leads with $2,186 per square foot, far ahead of Bath & Body Works ($1,327) and Best Buy ($1,055). Its warehouses, about 148,000 square feet on average, run a narrow assortment at huge volumes for customers who pay a membership fee to get in. Gasoline sales also lift its revenue.
The next two places have other explanations. Bath & Body Works sells high-value products from small shops, averaging 2,851 square feet of selling space. Best Buy makes 34% of its US revenue online, and the ratio sets those sales against store space only. The calculation favours it mechanically.
Grocery ahead of general merchandise
Supermarkets beat general merchandise stores. Kroger generates $820 per square foot, Albertsons $743, Sprouts $678. Walmart, which mixes supercenters, Sam’s Club and international, is at $675. Target ($418) and Lowe’s ($440), with much larger stores, sit below the median.
Department stores and discounters at the bottom
The bottom of the table brings together two opposite models. Department stores Macy’s ($231), Kohl’s ($192) and Dillard’s ($143) run very large spaces, reported as total space. Discounters such as Dollar Tree ($235) and Burlington ($341) sell at low prices, which pulls the ratio down without saying anything about their profitability.
That is the limit of the exercise. Revenue per square foot measures commercial density, not profitability. It does, however, say a lot about what a landlord can expect from a tenant, and about the pressure a rent quoted per square foot puts on it.
Method and limits
Revenue: total reported in the latest annual 10-K, as published in the SEC’s structured (XBRL) data. Space: year-end figure taken from the text of the same report (1 square metre = 10.7639 square feet). Fiscal years ended between December 2025 and August 2026.
The ratio flatters retailers with large online sales, such as Best Buy, because those sales are set against store space only. It includes fuel at Costco and Kroger. Space is not defined the same way everywhere: selling space at Lowe’s, Kohl’s or Ross, total space at Macy’s or Dillard’s, which penalises the latter. One example: Bath & Body Works itself reports $1,026 of store sales per average selling square foot, against $1,327 in our calculation, which includes its online sales.
Excluded: retailers that sell mostly online (Amazon, Wayfair, Williams-Sonoma), those whose revenue includes a professional distribution business without store space (Home Depot), and those that do not disclose a usable total store space (Dollar General, TJX, Ulta Beauty and Tractor Supply, among others).
Sources
- Annual 10-K reports of the 18 retailers, linked in the table
- SEC, EDGAR database