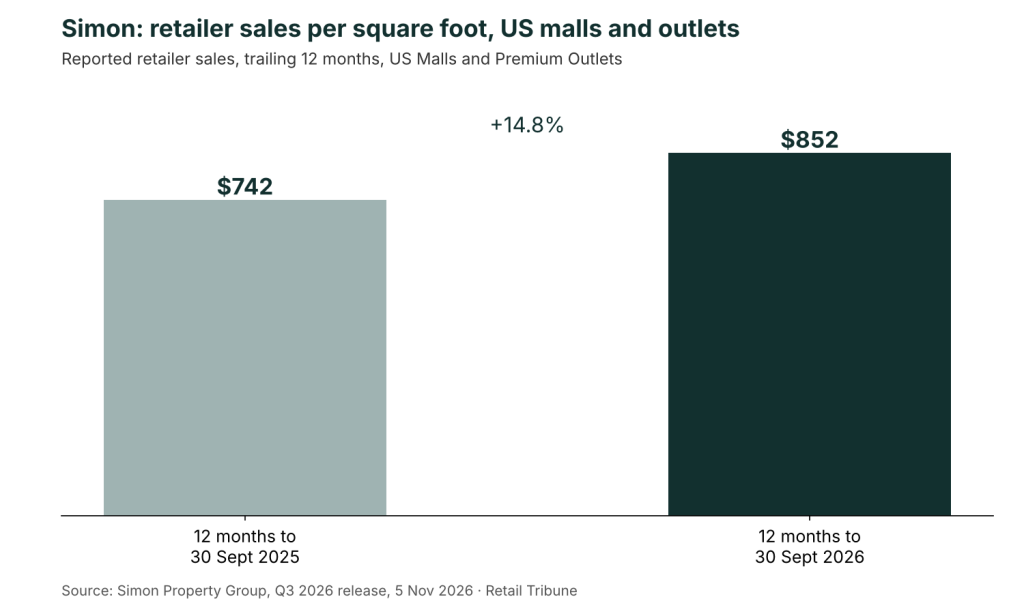
Retailers in Simon’s US malls and Premium Outlets reported sales of $852 per square foot over the twelve months to 30 September 2026. A year earlier the same measure stood at $742. That is a 14.8% rise, published by Simon Property Group in its third-quarter release of 5 November 2026.
The figure is “reported retailer sales per square foot”, on a trailing twelve-month basis, for the US Malls and Premium Outlets segment. It counts only what tenants report to the landlord. Simon does not give a fuller definition in the release.
What sits around it
Rents moved in the same direction, at a slower pace. Base minimum rent reached $62.75 per square foot, against $59.14 a year earlier (+6.1%). Occupancy barely changed: 96.5% at the end of September, 96.4% twelve months before. Domestic property net operating income grew 6.6% in the quarter, and Simon raised its full-year Real Estate FFO guidance to $13.30 to $13.40 per share.
| US Malls and Premium Outlets | 30 Sept 2025 | 30 Sept 2026 |
|---|---|---|
| Reported retailer sales per sq ft (12 months) | $742 | $852 |
| Base minimum rent per sq ft | $59.14 | $62.75 |
| Ending occupancy | 96.4% | 96.5% |
| Number of properties | 162 | 174 |
| Total square footage (millions) | 136.0 | 148.6 |
Read together, the numbers say tenants’ sales are growing more than twice as fast as their base rent. For a landlord that is room to push rents at the next renewals. For a retailer it means the occupancy cost ratio is falling on paper.
The limit
The perimeter is not the same from one year to the next. The segment had 174 properties at end-September 2026 against 162 a year earlier, and 148.6 million square feet against 136.0 million. The release also refers to a transaction on The Taubman Realty Group dated 31 October 2025. Simon does not say whether the $852 compares like for like with the $742, so part of the increase may come from a different mix of centres. The measure also depends on tenants that report sales, which excludes some space.
For comparison with retailers’ own figures, our analysis of revenue per square foot at 18 large US retailers uses a different measure: total company revenue divided by store area.
Shopping centre owners and their portfolios are also tracked in the Retail Prospect registry, the shopping centre database published by HOWEB: retaildataset.com.
Sources
- Simon Property Group, earnings release and supplemental information, third quarter 2026, 5 November 2026 (Form 8-K, exhibit 99.1): sec.gov