Amazon spent $23.5 billion on advertising and promotion in 2025. Walmart, $5.4 billion in its latest fiscal year. Dollar Tree, $44.4 million. These figures do not come from a survey: each company reports them in its annual report (10-K), filed with the US Securities and Exchange Commission between February and March 2026.
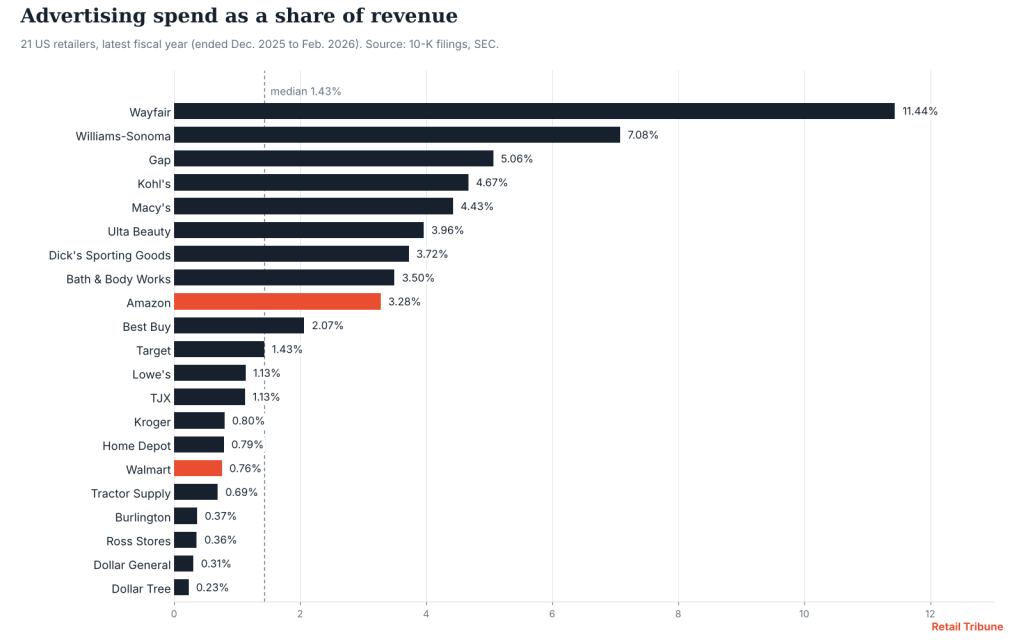
Measured against revenue, the gap changes scale. Wayfair spends 11.44% of its sales on advertising. Dollar Tree, 0.23%. That is a ratio of one to fifty between two listed retailers in the same market. The median across the 21 companies sits at 1.43%, exactly where Target is.
The table
Ranked by share of revenue, latest fiscal year. Each retailer’s name links to its annual report.
| Retailer | Fiscal year ended | Advertising ($m) | Revenue ($bn) | Share of revenue | Change year on year |
|---|---|---|---|---|---|
| Wayfair | 2025-12-31 | 1,425 | 12.5 | 11.44% | −3.2% |
| Williams-Sonoma | 2026-02-01 | 552.6 | 7.8 | 7.08% | −2.7% |
| Gap | 2026-01-31 | 778 | 15.4 | 5.06% | −0.3% |
| Kohl’s | 2026-01-31 | 725 | 15.5 | 4.67% | −7.9% |
| Macy’s | 2026-01-31 | 1,001 | 22.6 | 4.43% | −9.2% |
| Ulta Beauty | 2026-01-31 | 491.0 | 12.4 | 3.96% | +13.8% |
| Dick’s Sporting Goods | 2026-01-31 | 641.1 | 17.2 | 3.72% | +23.5% |
| Bath & Body Works | 2026-01-31 | 255 | 7.3 | 3.50% | +5.4% |
| Amazon | 2025-12-31 | 23,500 | 716.9 | 3.28% | +9.8% |
| Best Buy | 2026-01-31 | 861 | 41.7 | 2.07% | +1.8% |
| Target | 2026-01-31 | 1,500 | 104.8 | 1.43% | +0.0% |
| Lowe’s | 2026-01-30 | 978 | 86.3 | 1.13% | +6.2% |
| TJX | 2026-01-31 | 680 | 60.4 | 1.13% | +10.2% |
| Kroger | 2026-01-31 | 1,180 | 147.6 | 0.80% | +0.8% |
| Home Depot | 2026-02-01 | 1,300 | 164.7 | 0.79% | +8.3% |
| Walmart | 2026-01-31 | 5,400 | 713.2 | 0.76% | +5.9% |
| Tractor Supply | 2025-12-27 | 107.7 | 15.5 | 0.69% | +13.1% |
| Burlington | 2026-01-31 | 42.4 | 11.6 | 0.37% | +20.1% |
| Ross Stores | 2026-01-31 | 82 | 22.8 | 0.36% | +16.8% |
| Dollar General | 2026-01-30 | 130.9 | 42.7 | 0.31% | +6.5% |
| Dollar Tree | 2026-01-31 | 44.4 | 19.4 | 0.23% | +56.9% |
The business model sets the budget
At the bottom of the ranking are the discounters. Dollar Tree (0.23%), Dollar General (0.31%), Ross Stores (0.36%), Burlington (0.37%). Their pitch is the shelf price. They spend little, which fits what they sell.
Just above are the volume giants. Walmart (0.76%), Home Depot (0.79%), Kroger (0.80%). In absolute terms that means hundreds of millions, even billions of dollars. Against revenue of nearly $150 billion to more than $700 billion, it is less than 1%.
The top of the table tells another story. Wayfair, which sells furniture almost entirely online, has to buy its traffic: $1.4 billion of advertising for $12.5 billion of sales. Williams-Sonoma (7.08%) and Gap (5.06%) are defending brands. Department stores Kohl’s (4.67%) and Macy’s (4.43%) stay near the top, even though they are making the deepest cuts.
Amazon is a case apart: 3.28% of revenue, but by far the largest budget in the panel. Together, Amazon and Walmart account for 69% of the $41.7 billion spent by the 21 companies.
Department stores cut, discounters step up
Only five retailers reduced their budget year on year. The steepest cuts came from Macy’s (−9.2%, from $1,102 million to $1,001 million) and Kohl’s (−7.9%, from $787 million to $725 million). Wayfair, Williams-Sonoma and Gap trimmed slightly.
On the rise, Dollar Tree went from $28.3 million to $44.4 million (+56.9%), a jump from a very low base. Dick’s Sporting Goods (+23.5%), Burlington (+20.1%), Ross Stores (+16.8%) and Ulta Beauty (+13.8%) follow. Amazon added $2.1 billion in a year (+9.8%).
Method and limits
Advertising spend is the figure each company reports in its 10-K, as published in the SEC’s structured (XBRL) data. Walmart’s figure was checked against the text of the report. Revenue is the total reported for the same fiscal year. Fiscal years end between late December 2025 and early February 2026. Amounts are in current dollars.
Each company uses its own definition. Ulta Beauty and Home Depot net out certain vendor advertising allowances, Dick’s Sporting Goods nets cooperative advertising. Kroger books this cost in merchandise costs. Amazon reports “advertising and other promotional costs”. The comparison gives orders of magnitude, not a precise like-for-like measure.
Not included: in-store discounts and promotions, loyalty programmes, marketing staff salaries. Chewy was excluded because its “advertising and marketing” line includes payroll. Costco does not report this figure in its structured data. The panel is limited to US-listed retailers.
Sources
- Annual 10-K reports of the 21 retailers, linked in the table
- SEC, EDGAR database